Campaign and target analyses
You can use the campaign and target analysis to visualize the success of landing pages visually and as a percentage.
For example, you can evaluate and visualize the extent to which a campaign via Facebook, Google or a newsletter has led to the defined goal - e.g. contact via form, order or booking.
The Weblication statistics and associated tools offer a wide range of analysis options.
The "General" tab of the statistics provides an overview of page views with labels and filters for interaction tracking and campaigns.
The "Campaign, target analyses" tab loads the visitor flow analyses (click on "Visitor flow" for a page from the statistics). On the other hand, target analyses can be filtered here, which have been defined as targets.


Operation

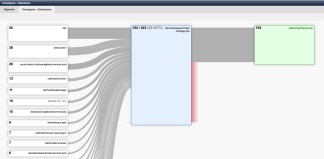
The diagram shows which pages visitors use to reach the defined target.
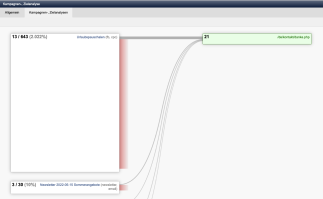
The screen shows the evaluation of the campaign and target analysis for the selected target (selection box top right). In the content, you will find the entry points with the number of views on the far left. For campaigns, in addition to the number of views, the number of visitors going on to the page to the right is also displayed. This can be a page that is used for a funnel analysis or directly the target page (green box). For example, 13 / 643 means that 13 page visitors of the 643 views go on to the next page. This number is also displayed in brackets as a percentage (e.g. 2.022%). If 0 / xx is displayed for a campaign, this means that no one who came to this page via the campaign subsequently accessed the page visible to the right.
The green box in the right-hand area represents the target page and indicates the number of views that ultimately came via the path being analyzed.
There are various functions at the top, which are described below.
'back / forward':
This button can be used to switch between the defined destinations.
This navigation option is available if more than two destinations have been created.
'Period (selection box)':
The time period for the display can be selected via this selection box.
'Destinations (selection box):
This selection box can be used to switch between the destinations created. The screen is reloaded with the data of the selected destination.
'Define destinations':
Clicking on this button opens a new window which allows you to edit the existing goals. New destinations can also be defined and existing ones deleted here.


