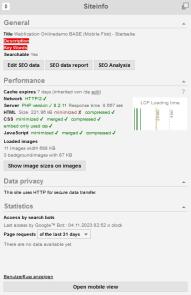
Browse & Edit - Page information
As a logged-in user, you can use various information about a page directly in the page view in the browser. Whether the function integrated in the project is available depends on the project implementation and the authorizations assigned to you as a user.
The page information provides information about various metadata of the page, the set cache, Google™ accesses, etc.


Weblication® Panel - Attach/detach icon for page information
Operation
The page information box, which can be accessed via the page view, is described in more detail below. The box can be hidden or shown using the rectangle symbol in the top right-hand corner. It can also be hidden or shown by clicking on the icon in the Weblication® panel.
'This page contains an XML error':
If there is an XML error in the generated page, an administrator receives a red link at the top of the siteinfo box indicating this. By clicking on this link, more detailed information on the error can be called up.
'General'
'Title':
Output of the HTML title of the generated page(title tag).
'Description':
Output of the HTML description of the generated page (description tag).
'Keywords':
Output of the HTML keywords of the generated page(keywords tag).
Keywords / keywords that are not contained in the generated page as text are output in red font color.
'Searchable':
Output whether search robots / search engines are allowed to search this page or not(robots tag).
'Original URL':
Output of the original URL (canonical tag).
'Edit SEO data / Open SEO report':
Clicking on the 'Edit SEO data' button opens a new window with the editing mask for the SEO data.
Clicking on the 'SEO report' button opens a new window with the SEO data report of the currently accessed project.
'Speed'
'Cache duration':
Output of the cache duration for the page called up.
'Network':
Output of the HTTP web protocol (display whether HTTP/2 is available).
'Server':
Output of server information (e.g. PHP version used, response time).
'HTML':
Output of HTML information (e.g. file size of the currently accessed page, status for minimization, compression (encoding: gzip), etc.).
For further technical information, see the developer area article.
'CSS':
Output on CSS information (e.g. status on minimization, merging of CSS files, compression, etc.).
For further technical information, see developer area article.
'JavaScript':
Output for JavaScript information (e.g. status for minimization, merging of JS files, compression, etc.).
For further technical information, see the developer area article.
'Loaded images':
Output to image information (e.g. number and file size).
By clicking on the "Show image sizes on images" button, the page shows a tooltip for each image with the quality and file size of an image.
'LCP loading times':
This graphic shows you the LCP loading times per page in graphical form so that you can initiate countermeasures if necessary. The Web Vitals values taken into account by Google as ranking factors since May 2021 are defined as follows
- FCP (First Input Delay)
- LCP (Largest Contentful Paint)
- CLS (Cumulative Layout Shift)
Only LCP and CLS are usually relevant for project optimizations. LCP indicates when the largest, i.e. most relevant part of the page was loaded.
'Data protection'
Output of information on data protection (e.g. whether HTTPS is used for secure data transfer).
'Statistics'
'Search engine hits':
Output for monitoring the search engine ranking of the accessed page. You activate the monitoring itself in the project configuration by setting "Monitor Google™ ranking" to "Yes". This then also includes the Bing search.
When a search service (Google™ or Bing™) is called up, the last indexing is displayed with the date and time (time when the crawler retrieved the page). Please note that this is not necessarily the time at which the index is updated by the search service itself.
This SEO tool provides a quick overview of the Google ranking in day-to-day work.
The diagrams can be displayed in the selection of page views for the past 31 or 93 days:
- Past x days
This diagram graphically displays the page views for the past days selected.
The green line shows the 7-day moving average. - Views
This diagram shows the page views for the days selected in the past and also provides the average page views per day. - Position
This diagram shows the position of the current page in comparison to all other pages. - Mobile share
This diagram shows the page views of mobile devices as a percentage.
'Open mobile view'
Clicking on this button opens the current page in mobile view via a layer.
Please note the following regarding the significance of the analysis:
- Search results accessed via an HTTPS Google search cannot be included in the analysis (referrer not available).
- In addition to the last access from Google/Bing, an attempt is also made to determine the search term entered, which in the meantime no longer works properly due to the lack of referrers, etc.


