Server monitoring
Which websites and which Google search terms are used to access my site? What are the script runtimes of the individual pages on the server? Are there any performance-critical scripts? When do search engines index my website? What is the memory requirement? What is the daily progression of hits? Are there any outliers? Who is accessing which information?
Server monitoring in Weblication® CMS to log page accesses:
An infinitely valuable tool for security, performance and SEO. You finally get information that analytics tools don't otherwise provide.

Operation
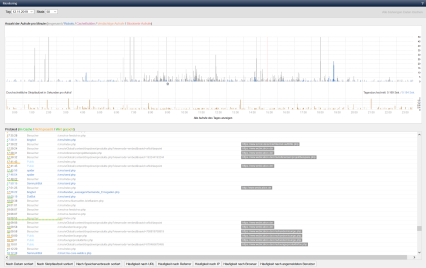
Server monitoring provides you with various diagrams in the screen called up and offers corresponding selection options.
'Tag':
You can use the selection box to select the day for which you want to display the logging of the monitoring.
'Scale':
You can use the selection box to select the value for the scale of the first diagram (calls per minute).
'Diagram: Number of calls per minute (total / Robots / CacheBuilder / Suspicious calls / Blocked calls)':
The diagram illustrates the views within the content/language projects of a day.
The x-axis shows the progression over time within a day (hourly blocks in the time window 0:00 to 23:59).
The y-axis shows the number of calls per minute. The calls are divided by color into the total calls (grey), the proportion of robots (blue), the cache builder (purple), the suspicious calls (orange) and the blocked calls (red). The scale value varies depending on the value selected in the scale selection box (see above).
The following symbols can be displayed below the scale:
- Pencil icon
Symbolizes editing of a file by a Weblication® CMS user - Trash icon
Symbolizes the deletion of the project cache.
Click in the diagram to select the corresponding block of hours, which is marked with a red frame. The log view in the lower window is then limited to the selected block of hours.
'Diagram: Average script runtime in seconds per call':
The diagram illustrates the average script runtime of the page views within the content/language projects of a day. The daily average in seconds (page visitors / robots) is shown on the right above this diagramm.
The x-axis shows the temporal progression within a day (hourly blocks in the time window 0:00 to 23:59).
The y-axis shows the average script runtime in seconds per call. The grid ranges from 0 to 2 seconds.
Click in the diagram to select the corresponding hourly block, which is marked with a red frame. The log view in the lower window is then limited to the selected hourly section.
'Button: Show all calls of the day':
By clicking on this button, the log in the lower window lists all calls of the day.
Log view in the lower window:
In the lower frame of the server monitoring you get the log view of the individual page views. The lines in the first two columns have different font colors depending on the caller.
- gray
Indicates a "normal" page visitor (browser call) - brown
Indicates a call by a logged-in Weblication® user. - blue
Indicates a call by a search engine (common robots such as Google, Bing and Yahoo are taken into account here).
Each line provides further detailed information on the page call (IP, user agent, script runtime, memory usage) when the mouse is moved over the alternative text.
Example:
"IP: 78.43.* (Mozilla/5.0 (Windows NT 6.1, WOW64, rv:13.0) Gecko/20100101 Firefox/13.0.1) Script Time: 0.454 Memory Usage: 12.048"
The script runtime is displayed as an orange bar starting below the time. Pages that use a file cache are displayed with a green bar. If a page is (re)cached when it is called up, this is shown with an orange-green dashed bar.
'Time':
This column shows the time at which the page was accessed.
'IP address':
This column shows the IP address used by the caller or user agent. If you have set the recommended setting for an anonymized IP address for logging, only the first two number blocks of the IP address are logged and therefore displayed.
'Number of hits':
This column shows the cumulative number of times an IP address has been accessed within the selected time period (1 hour or the day).
'Called URL':
This column shows the URL that was called up.
'Referrer URL':
This column displays the URL from which the caller reached the URL specified in the previous column ('Called URL') (the so-called referrer). If it is a reference via a Google search result URL, the position information with the specified search terms is displayed instead of the URL. By clicking on the referrer or the Google information, you open the corresponding URL in a new window.
If the referrer cannot be read, the column remains empty.
Please note that most current browsers have already deactivated the referrer by default!

Buttons in the lower area:
'Log view'
:Clicking on this button sets the log view to the standard view (chronological sorting).'
Sorted by script runtime
':Clicking this button sorts the log view by script runtime (descending).'Sorted
by memory usage
':Clicking this button sorts the log view by memory usage (descending).
'Frequency by URL'
:Clicking on this button sorts the log view according to the frequency of a URL call (descending). The log view changes to a two-column view with the number of calls to the corresponding URL.
'Frequency by referrer':
Clicking on this button sorts the log view according to the frequency of the referrer (descending). The log view changes to a two-column view with the number of hits to the referring URL.
'Frequency by IP':
Clicking on this button sorts the log view according to the frequency of the accessing IP address (descending). The log view changes to a two-column view with the number of hits for the corresponding IP address.
'Frequency by browser':
By clicking on this button, the log view is sorted according to the frequency of the accessing browser (user agent) (descending). The log view changes to a two-column view with the number of calls to the corresponding browser.
'Frequency by logged-in user':
Clicking on this button sorts the log view according to the frequency of the logged-in user (descending). The log view changes to a two-column view with the number of calls to the corresponding user. If no user is displayed, it is a "normal" site visitor or a search bot.
Please note
- You can activate or deactivate server monitoring in the BASE via the project configuration ('Analysis' - 'Log page accesses'). This setting is accessed by the PHP framework function - wPageCur::logRequest in the pre.php of the global project.
- Please note that old log files - if desired - must be deleted manually! Depending on the available disk space and the number of files within a directory, it may be necessary to delete old log files. By default, the log files are stored under /[YOUR-GLOBAL PROJECT]/wGlobal/logs/requests and are protected against direct access via .htaccess.
From Weblication® CMS version 007.001.205.000, you can manually set the log files for monitoring to be deleted after the specified number of days (see article"Logging page accesses" for the limit for log files).


